US-based nonprofit organizations are required to file Form 990, detailing their executive leadership, assets, cash flow, and multiple layers of financial information. These forms are collected and publicly shared by the IRS. Foundations who file Form 990PF, and other nonprofits who file Form 990, report grants given to other nonprofit organizations, individuals, or other entities. The IRS e-file dataset contains the tax forms of all nonprofits who filed electronically since 2013 (note tax forms are typically filed one year later, i.e. forms filed in 2013 contain information about 2012, and some organizations file 2–3 years after the reporting period ends)57. We analyzed 3,660,949 forms from 685,397 organizations spanning the entire space of nonprofits including those involved in education, health, human services, environmental issues, religion, and art (see Appendix 1). We next identified 10,338,779 grants listed on the givers’ tax forms and applied a matching algorithm56 to determine employer identification numbers (EINs) for 8,186,055 grant recipients (see Appendix 1). Given our focus on art, we next reduced the data to organizations under the category of ‘Arts, Culture, and Humanities’ from the National Taxonomy of Exempt Entities Codes (NTEE), allowing us to identify 149,291 art organizations. It must be noted that while the NTEE classifications have been widely used in philanthropic studies48, they remain imperfect and some listed art recipients may be improperly categorized and others might be missing. For example, the Art Institute of Chicago and Pennsylvania Academy of Fine Arts, are classified under education.
For each art institution, we mapped grants listed on donors’ tax forms to the institution. To demonstrate the depth of the final dataset, in Fig. 1 we show a subset of the data, capturing grants to art recipients in New York City (NYC). To construct the NYC art funding network, we took each art institution with a NYC address and identified all grants to that institution, arriving at 2144 art institutions who received at least one grant. We then filtered the network to include only grant relationships that totaled over $1M over the course of the decade, leaving 200 recipients and 314 donors. Limiting the network to the largest set of connected donors and recipients, we arrived at 144 recipients and 246 donors connected via 552 grant relationships. The final network shown in Fig. 1 represents the core of New York City art institutions and the major donors supporting them, illustrating the depth of the collected data.
The art philanthropy network. Yellow nodes represent art recipients with a New York City address and purple nodes are donors to those institutions (some of whom may be outside New York). Links show funds given by a donor to a recipient and the width of each link is proportional to the amount of the donation. A core set of donors in the center, including donor advised funds, the Ford Foundation and the Mellon Foundation support multiple art recipients, while other donors in the periphery tend to support a single art recipient. Only donor-recipient relationships involving a total over $1M for the decade are shown.
While the data has tremendous richness, it also has known limitations. First, we only have data on foundations who filed electronically and do not have access to paper filers. It is estimated that electronic filers are around 80% of all filers of Forms 990 and 990PF56. Second, we relied on a matching procedure to identify the recipient EINs and this matching has accuracy and coverage limitations, identifying only 85% of recipients. Many of the unidentified organizations are foreign groups, public entities such as schools and cities, individuals, and for-profit companies, though some non-profit recipients may also have been unmatched due to filing errors like listing an unofficial name or incorrect address. Among the successfully determined matches, the error rate is estimated to be around 2.6% based on a hand-checked subset of grants56. Finally, our data only tracks donations by foundations and lacks information on individual or corporate giving.
Philanthropic funding in art
Of the 149,291 organizations categorized under Art, 48,766 (31%) received at least one grant from one of 46,643 donor organizations. Between these organizations, we identified 798,670 grants connecting givers to receivers. The grants totaled $36B over the 2010–2019 decade, reaching $5.9B per year in 2019, considerably higher than the $1.4B that Grantmakers in the Arts, a national association of art funders in the US, estimates to have been given to art in 2018 by public sources, including local, state, and federal entities2. Within art, there are multiple types of organizations, as classified by the detailed NTEE codes. Performing arts (NTEE codes beginning with ‘A6’), including, Operas, Dance, Ballet, Theaters, Performing Arts Schools and other subcategories leads both in the number of grants and the largest amount of grants. Indeed the 14,363 performing arts organizations received 262,572 grants totaling $9.7B (Fig. 2). The next largest recipient is Museums (codes beginning with ‘A5’), including art museums, children museums, history museums, and science museums, that together received 146,102 grants, totaling $8.9B. Note that these funds go to only 4463 museums, compared to three times as many performing arts recipients (14,363), implying that on average a museum received $2.0M over the decade, while a performing arts organization received less than half of that, approximately $675k on average. Other recipient areas include 2761 Media organizations ($5.7B, codes beginning with ‘A3’) such as radio, television and film; 7178 Multipurpose Arts Organizations ($3.1B, ‘A2’); 7393 Historical Societies ($2.0B, ‘A8’), and others.
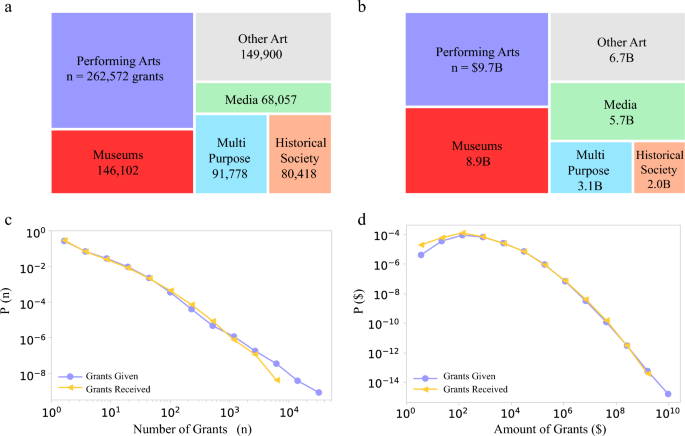
Grants to art and culture. (a) The number of grants given to several major areas within art, together representing 798,827 grants. Note that ‘Other Arts’ includes art institutions such as those involved in Art Services, Humanities, and Folk Arts. (b) We show the distribution of $36.2B dollars that goes towards art, within the areas of art that received the most funds. (c) The distribution of the total number of grants given and received. (d) The distribution of the total amount of grants given and received by art organizations. Art funding is focused on museums and performing arts, and other areas receive smaller fractions of both grants and funds. The broad distribution of grants given and received indicates that a small subset of institutions and donors are responsible for a significant portion of funds.
In most subcategories we find more givers than receivers. For example, while there are 393 Opera organizations, the number of organizations that donated to opera is about an order of magnitude larger at 3417. Similar imbalances are present in Ballet, Symphony, and Museums. At the same time, we find that the same group of funders tend to support multiple types of art institutions. For example, over 62% of those who gave to a museum also supported a performing arts institution and 56% of those supporting a historical society also supported a museum. We also find that 20,236 donors gave to a museum, implying that 43% of all funders that gave to art supported at least one museum.
Beyond competing with other art institutions, art recipients also compete for donor funds with other areas as well. Indeed, only 28% of art donors gave either a plurality or all of their grant funds to art institutions (Fig. 3a). In contrast, close to half of the funds (43%) came from donors whose main area was outside of art (Fig. 3b), suggesting that art institutions tend to rely on donors whose primary focus is not art. Finally, even those with a primary focus on art often only gave 20–50% of their funds to art (Fig. 3c).
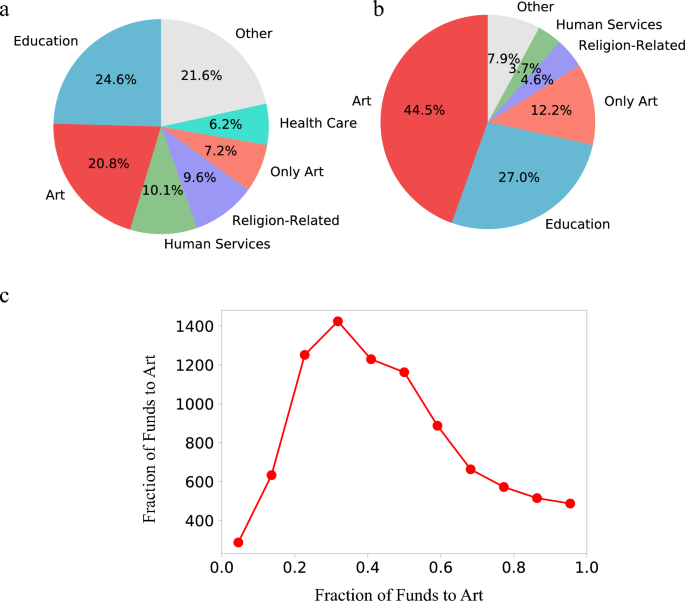
Art is rarely the main focus of art donors. (a) The primary interests of art donors as measured by where they gave the most funds. Only 28.0% of art donors gave most or all their money to art. Many art donors have a primary focus in Education, Human Services, Religion, or Health Care. (b) Donors with a primary focus in art make up a large fraction of the total funding to art (56.7%), though nearly half of art funding comes from donors whose primary focus is in other areas. (c) For donors whose primary focus is art, we show the fraction of their funds that went to art. Even for donors whose primary focus is in art, only 20–60% of their total giving goes to art.
To place these results in context, we compare the patterns characterizing art funding to those patterns observed for science philanthropy. While there are four times more art organizations than science organizations (34,091 science organizations versus 149,291 in art), 39% of science organizations received at least one grant, compared to 31% of art organizations. The biggest difference is in the total amount of funds given to science from 2010 to 2019, which was $207B, nearly 7 times the amount given to art. Furthermore, science benefits from substantial government funding, including $40B/year from the National Institute of Health and nearly $10B/year from the National Science Foundation, both part of a total $65 billion annual US federal science budget58.
It has been previously suggested that the comparatively fewer organizations carrying out science as opposed to funding science is due to the fact that science often requires high costs for equipment and implementation56. Art on the other hand can be less capital intensive, leading to a greater balance between the number of donors and recipients, though certain areas of art, like museums, do require considerable funds to maintain their activity.
Taken together, we find that in art there are more organizations competing for less funds from fewer funders compared to science (see Table 1). At the same time, it is important to clarify that science organizations, like universities, tend to contain multiple independent departments and research labs, each competing independently for funds, thus the competition in science is greater than it might appear based on the number of recipients.
Aside from the larger number of recipients, art is also distinct from science in that the primary focus of art funders is often outside of art. Indeed, less than 60% of funds came from organizations whose primary focus is art (Fig. 3b), in contrast over 90% of funds donated to science comes from funders whose primary focus is science (i.e., gave more to science than to any other category).
Locality in art
Funders’ frequently stated preference for supporting their local communities31 raises the question: To what degree is philanthropic funding local, and what role do global funders with national reach play in art? We measure locality by comparing the reported recipient state to the donor’s state of incorporation. We find that 61% of dollars and 56% of grants are local, meaning that the recipient is in the same state as the giver (Fig. 4a). Both numbers are significantly greater than expected if donors dispersed funds nationally, disregarding local interests. Indeed, a degree-preserving national null-model (see Appendix 2), which maintains the number of grants given and received for each funder and recipient, but randomly shuffles the recipients nationally, predicts that less than 5% of dollars and grants would be local.

Art funding is local. (a) The number and amount of grants given in the same state compared to a national null model indicates that the fractions of dollars and grants given locally is significantly greater than random. (b) The fraction of donors whose kth largest grant is given in the same state as the donor’s location. While science donors’ 10th largest grant is local only 35% of the time, in art this number is 61%, meaning that an art donors’ smaller grants are local at a considerably higher rate.
We find that 22,223 funders (48% of all funders) support exclusively local art institutions (same state as the funder). Just over half of these (11,633) only gave to a single art recipient, while 899 gave to at least 10 different local art recipients and 26 gave to 50 or more art recipients in their home state. Some of these 26 major local funders are local art or humanities organizations with a stated local mandate. There are, however, many private foundations with an exclusive local focus, such as the Char and Chuck Fowler Foundation in Ohio that gave to 81 Ohio-based art organizations, the Reser Family Foundation that gave to 69 different Oregon-based recipients, and the Lily Auchincloss Foundation that gave to 102 art organizations in New York. Interestingly, major national foundations that support art across the US tend to nevertheless have a local emphasis. For example, 47% of the 490 art organizations receiving support from the Macarthur Foundation are in Illinois, 49% of the 660 art organizations receiving from the Ford Foundation are in New York, 41% of the 353 organizations receiving from the Mellon Foundation are in New York, and 54% of the 229 organizations receiving from the Getty Trust are in California.
The fraction of dollars distributed locally is similar to the fraction observed in science philanthropy, however we find that the 56% of grants awarded locally in art is considerably higher than in science, where only 35% of grants were local. This suggests that while in science smaller grants may be given to more distant institutions, in art, even smaller grants tend to be local. Indeed, in Fig. 4b we see that art funders’ 10th largest grant is still local in over 60% of cases, in contrast with science where the 10th largest grant was local in only 35% of cases. Furthermore, in science the largest grant was local in 50% of cases, indicating that science funders’ largest grants are more likely to be local than their smaller ones, while in art this ratio is roughly constant.
The observed differences between science and art are partly rooted in the experiential aspects of art. While one can visit a scientific lab, most science funders rarely do so, since personal experience and engagement is not the primary aim of science philanthropy. In contrast, for most forms of art, access to special events and preferential donor treatment, can be an important motivation for giving43. Thus, whereas in science a donor may choose to support research at a distant university if the focus of the work advances the donor’s personal and philanthropic goals, an art donor is more likely to support local institutions whose exhibitions or performances are readily accessible to both the donor and their community.
An important consequence of this local focus of funders is that art organizations from the same local area tend to rely on the same funders even if they offer different experiences, or produce distinct art forms. To show this we built a network of recipient institutions who are connected if they receive funds from the same donors (Fig. 5). We see that within each major metropolitan area of the US there are strong cofunding patterns, even when the recipient institutions offer distinct experiences. For example, in New York, the Metropolitan Museum of Art (MET) received funds from 1374 donors, more than any other art institution. Many donors of other major New York City-based institutions also tended to donate to the MET, including 60% of MOMA’s donors, 55% of Whitney donors, 51% of Lincoln Center donors, and 37% of the Metropolitan Opera’s donors (see Fig. 6a). For example, the Leon Levy Foundation reported 2019 grants of $228,988 to MOMA, $162,000 to the Metropolitan Museum of Art, and $10,000 to the Lincoln Center. In contrast, geographically distant institutions, even if they offer similar experiences, rarely or never share many donors (Fig. 6b). For example, the Art Institute of Chicago shares only 10% of its donors with MOMA in New York and only 12% of its donors with the MET, despite having overlapping artistic profiles and missions. This confirms that competition for funds in art is focused on the region rather than the topic.
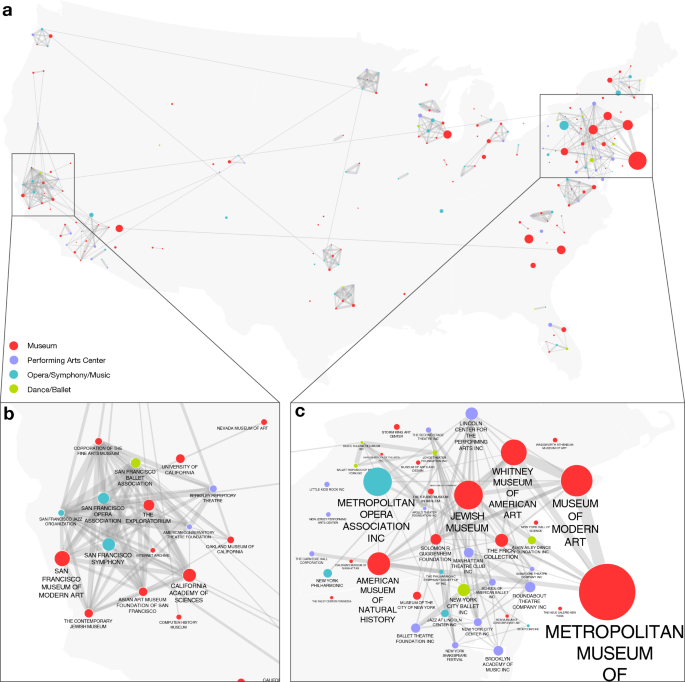
Donor overlap in art. (a) Nodes represent institutions and links represent shared donors. We limit the nodes to organizations receiving funds from at least 50 distinct donors and a total of $10M over the decade. Link widths reflect the Jaccard of the set of donors to each institution. Only links with Jaccard weight above 0.1 are shown. Institutions in the same city tend to have high donor overlap even when offering distinct experiences. At the same time, there are very few links across the nation, indicating that institutions with similar artistic offerings in different geographic regions rarely share donors. We show closeups on the regions of (b) San Francisco and (c) New York.
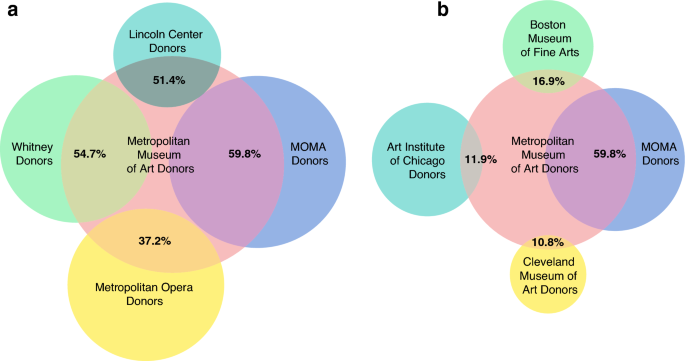
Funder overlap is local, rarely global. For different institutions, we show what fraction of their funders also gave to the Metropolitan Museum of Art. (a) Institutions in New York, even if they offer seemingly distinct experiences from the MET, have high rates of overlap in their funders. (b) Art museums outside of New York tend to have a low fraction of their donors overlapping with the Met, indicating that art funders give to a variety of local institutions rather than distributing nationally among top institutions offering similar experiences. For additional examples see Appendix Figs. A1, A2.
To a large extent, the local focus in art funding that we documented above is expected as art funders are often explicit about building local capacity in art to benefit their communities. At the same time, the degree of locality in funding of art is surprising given the trends towards globalization in many areas over recent decades. Moreover, such local funding raises issues of fairness and equity: the source of wealth of most large foundations is rooted in national or international enterprises. The redistribution of this wealth to local institutions can exacerbate existing inequalities, as most foundations are based in already wealthy areas of the US.
Stability and donor retention in art
An important factor in philanthropic funding is donor retention, capturing the degree of recurrent support over multiple years35,36. In art, receipt of a prior grant is a strong predictor of future relationships between the donor and recipient. Indeed, we find that 68% of grants repeat one year later, 57% are continued three years later and 50% last 5 years or more (Fig. 7a). These numbers far exceed donor retention for a crowdfunding platform, where only 26% of donors gave one year later35. For foundations, retention strengthens over time, as those who gave 2 years consecutively gave again in 80% of cases and those who gave 7 years straight continued to give the next year in 90% of cases (Fig. 7b). We also find that donors who give fewer grants to art organizations are more likely to consistently support the same recipient, with almost 70% of donors with only a single recipient supporting that recipient for 7 consecutive years from 2013 to 2019. For donors giving to 10 different recipients, only around 30% of their recipients received support every year from 2013 to 2019 (Appendix Fig. A3). Similarly, grantors who gave more funds over the decade were more likely to have given annually- those who gave only $1000, gave annually in just 20% of cases, whereas those who donated over $1,000,000, gave annually in 60% of cases (Appendix Fig. A3). The strong donor retention in art can enable institutions to develop financial plans based on likely future revenue from contributions. At the same time, donor retention tends to benefit established organizations and the funds earmarked over many years represent barriers for funding new organizations or programs.

Philanthropic grants are stable in time. (a) The fraction of grants overlapping from one year to the next. Only grantors whose tax forms are available in both the original year and the comparison year are included. (b) The persistence of grants over time as represented by the likelihood of a grantor giving a grant next year based on the number of previous years they gave.
The role of prestige in art funding
Prestige captures the community’s perception of an organization’s influence and role, and likely plays an important part in an institution’s ability to attract funding. To explore the role of prestige, we rely on the quantitative approach developed by Fraiberger et al.40, which mapped the movement of artists between institutions, building a network of institutions linked by artists they both exhibited. Centrality in this network was found to strongly correlate both with the perceived prestige of an institution as coded by experts, as well as the market value of the exhibiting artists. We use the prestige values from Fraiberger et al., to examine the effect of prestige on an institution’s ability to attract funding. We limit the data to US museums and match these institutions to those included in the funding dataset, arriving to 609 US museums and non-profit galleries for which we have both prestige scores and funding profiles (see Appendix 1).
We find a strong correlation between prestige and the number of grants (Pearson Coefficient = − 0.27, Spearman Coefficient = − 0.49, p < 1e−10) and the total dollar amount of grants received by an institution (Pearson Coefficient = − 0.25, Spearman Coefficient = − 0.51, p < 1e−10). Indeed, the ten most prestigious institutions (top 1.7% of matched organizations) received over 1000 grants each on average, while lower-prestige institutions received from dozens to a few hundred grants (Fig. 8a). We also observe anomalies: the second-highest prestige institution, the Guggenheim Museum, receives less philanthropic support than institutions of similar prestige, likely because of its square footage, limiting it to a single exhibition at any time, compared to its high prestige peers that have multiple exhibition venues. Another outlier at rank 134 is the Jewish Museum in New York with 2146 grants, whose generous support is partly explained by its unique focus. In terms of the amount of grants (Fig. 8b), we observe a similar trend, with the most prestigious institutions attracting over $100M USD over the past decade, while lower-prestige institutions received in the range from $100k to $10M. An outlier at rank 260 is the Contemporary Jewish Museum in California which received over $20M dollars.
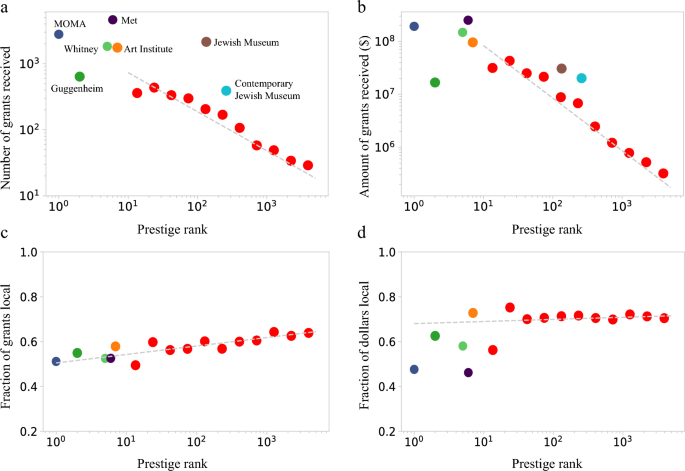
Institutional prestige affects philanthropic support. The number (a) and amount (b) of grants received by an institution (museum/gallery) as a function of the institutional prestige. The decreasing trend indicates that higher prestige museums receive greater philanthropic support. (c) The fraction of grants from local sources increases with decreasing museum prestige. (d) The fraction of grant dollars that come from local sources is largely independent of museum prestige.
We find that less prestigious institutions receive a greater fraction of their funds from local donors (Pearson Coefficient = 0.09, p = 0.03; Spearman Coefficient = 0.119, p = 0.004) though in terms of magnitude this increase is small (Fig. 8c). In terms of the amount of grants (Fig. 8d), the top 10 most prestigious institutions tend to receive a somewhat lower fraction of their philanthropic funding from local sources, though the trend is not significant (Pearson Coefficient = 0.01, p = 0.85; Spearman Coefficient = 0.07, p = 0.12). Overall, this suggests that more prestigious institutions might have greater success attracting donors outside of their local region than less prestigious institutions, though establishing the existence and the extent of this effect requires further data and research.
Disentangling the causal relation between prestige and funding, i.e., is a museum prestigious because it has access to funding or it receives funding because it’s prestigious, is challenging. The founding of new art museums, such as The Broad and Neue Galerie, supported by wealthy philanthropists may provide insight on this matter. As society and the art world’s focus on issues of equity and diversity has increased lately, it will be interesting to see how the renewed focus on diversity could alter both funding and notions of prestige. Will the most prestigious institutions diversify their offerings and continue to attract the bulk of funds or will institutions who currently have less prestige, but greater diversity, manage to attract more funds?
Credit:Source link


